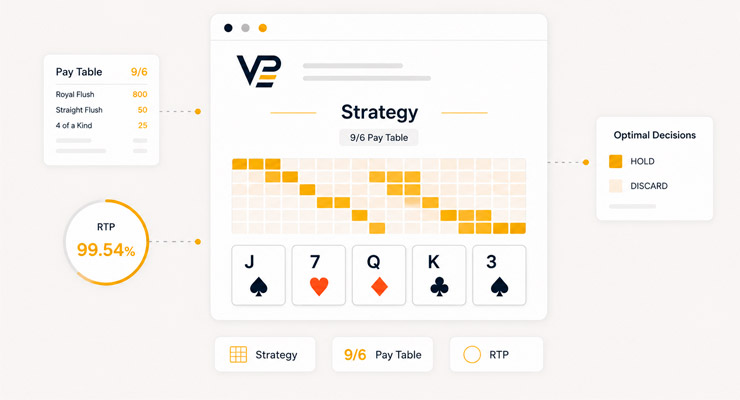
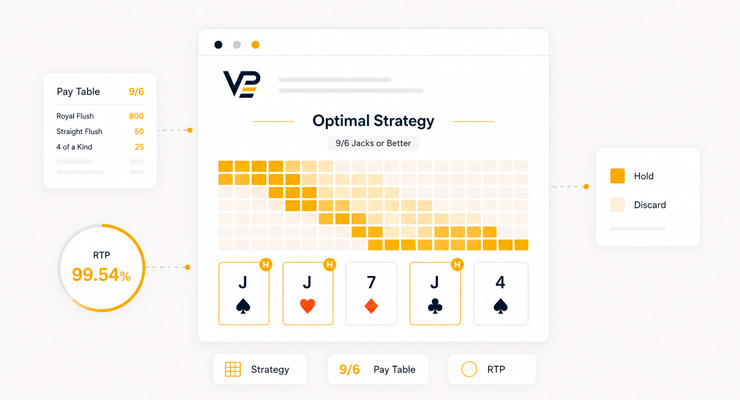
Jacks or Better strategy is what turns a 0.46% house edge into a real game. When paired with the 9/6 paytable, optimal play yields 99.54% theoretical return under max-coin bet.
This page covers the condensed practical strategy chart, a simpler version for new players, and the counterintuitive plays that often trip up sharp players who have not seen them before. The chart is organised by priority: scan top-down and select the highest matching play for your dealt hand.
For the broader variant overview, start with the Jacks or Better video poker guide. For paytable identification and how to spot a true 9/6 machine, see the 9/6 Jacks or Better pay table guide.
Educational content only. Gambling rules, availability, and legal age vary by jurisdiction.
The three strategy tiers
Optimal play is the ceiling, but it is not the only way to play 9/6 Jacks or Better. The Wizard of Odds publishes three strategy tiers, each with its own theoretical return:
- Simple strategy returns 99.46% — approximately 0.08 percentage points below optimal, equivalent to one wasted bet every 1,178 hands
- Intermediate strategy returns 99.52% — approximately 0.03 percentage points below optimal, equivalent to one wasted bet every 3,805 hands
- Optimal strategy returns 99.54% — the theoretical maximum for the 9/6 paytable
The right tier depends on play volume and personal preference. Learn simple strategy if playing recreationally; move toward optimal as session length and stakes increase.
Intermediate strategy is practical mainly as a bridge — most players go directly from simple to optimal once the chart structure is internalised.
The cost-of-error scales with volume. Over 500 hands at 5 credits per hand, total wagered volume is 2,500 credits. The simple-vs-optimal gap of about 0.08 percentage points equals roughly 2 credits of expected value over that sample. Strategy precision matters more in volume than per hand — the leak is small per decision but cumulative over time.
Optimal strategy chart
The chart below lists hand types in priority order. To use it: examine your dealt five cards, scan the list from top to bottom, and play the highest matching entry. Where two entries could apply, the higher one wins.
As Michael Shackleford of Wizard of Odds puts it: look up all reasonable ways to play a hand, and choose the play that is highest on the list. If a play is not on the list, it should never be played.
This chart is a condensed practical strategy chart for 9/6 Jacks or Better. It follows the same top-down logic as the Wizard of Odds optimal chart, but it groups several rare edge-case and penalty-card decisions into broader entries.
The full optimal chart published by Wizard of Odds contains approximately 36 priority lines plus a separate exceptions block covering rare penalty-card situations; the version below is functionally equivalent for everyday play and captures the vast majority of correct decisions. For tournament play or millions-of-hands volume, use the Wizard of Odds 9/6 optimal strategy page as the authoritative reference.
| Priority | Play | Notes |
|---|---|---|
| 1 | Full House or better (Royal Flush, Straight Flush, 4 of a Kind, Full House) | Hold pat — always |
| 2 | 4 to a Royal Flush | Beats pat flush, pat straight |
| 3 | 3 of a Kind | Draw 2 |
| 4 | Flush (pat) | Hold over 4-to-straight-flush |
| 5 | Straight (pat) | Hold over 4-to-flush, 4-to-straight-flush |
| 6 | 4 to a Straight Flush | Hold over high pair |
| 7 | Two Pair | Draw 1 |
| 8 | High Pair (Jacks, Queens, Kings, or Aces) | Hold over 4-to-flush, 4-to-outside-straight |
| 9 | 3 to a Royal Flush | Beats 4-to-flush in most configurations |
| 10 | 4 to a Flush | Hold over low pair |
| 11 | Low Pair (2s through 10s) | Hold over generic high cards |
| 12 | 4 to an Outside Straight (e.g., 6-7-8-9) | Open-ended — 8 outs to complete |
| 13 | 3 to a Straight Flush (high types) | Specific suited 3-card sequences |
| 14 | 2 Suited High Cards | KQ, KJ, QJ suited |
| 15 | 4 to an Inside Straight with 3+ High Cards | Only if 3 or more cards are J-A |
| 16 | Unsuited KQJ | Specific unsuited high-card combination |
| 17 | 2 Unsuited High Cards (J-Q) | Among unsuited combinations, J-Q preferred |
| 18 | Suited 10-J / 10-Q / 10-K | 3-to-royal sub-types with 10 |
| 19 | 1 High Card (Jack, Queen, King, or Ace) | All four worth approximately the same per Wizard of Odds |
| 20 | Discard all five | When nothing above applies |
Note on completeness: The full Wizard of Odds optimal chart adds approximately 16 additional priority refinements plus a separate exceptions list of about 80 unique hand patterns. These cover rare penalty-card situations — for example, when discarded cards specifically degrade a hand’s flush or straight potential. Each exception affects roughly one hand in tens of thousands. For everyday play, the condensed chart above captures correct play in virtually all situations.
How to use the chart in practice
The mechanical rule is straightforward: look at your five dealt cards, scan the chart top-to-bottom, and play the first entry that matches.
The harder skill is internalising the chart so decisions become near-automatic. Video poker machines run 500–700 hands per hour at full speed; sub-second decisions matter when sessions stretch to thousands of hands.
Most players need 2,000–3,000 hands of conscious chart consultation before play becomes fluent. The top 10 priorities cover approximately 80% of decisions — learn those first, refine the marginal plays later.
Three decision points freeze most players the first time they encounter them:
- High pair versus 4-to-flush — the high pair wins. A pair of Jacks-or-better is a guaranteed 1-to-1 payout with upgrade potential; the 4-to-flush completes only about 1 in 4.7 times for a 6-credit payout. Holding the pair has higher expected value
- Pat flush versus 4-to-royal — the 4-to-royal wins. This is counterintuitive because the flush is guaranteed and the royal is rare, but expected value calculations favour the draw
- Low pair versus 4-to-straight — the low pair wins. The straight draw feels closer to a strong hand but the pair produces better long-term return
For players who want to consult the chart during live play: some casinos permit printed strategy cards or reference materials, while others may restrict them. Rules vary by venue and jurisdiction. Check the venue rules before using a chart during live play.
Online video poker has no such restriction — chart reference is always available.
Simple strategy chart
The simple strategy returns 99.46% — small leak versus optimal but far easier to learn. It compresses the optimal chart into a more memorable structure suitable for casual play and learning sessions.
| Priority | Play | Notes |
|---|---|---|
| 1 | Royal Flush / Straight Flush / 4 of a Kind (pat) | Hold all |
| 2 | 4 to a Royal Flush | — |
| 3 | Three of a Kind | Draw 2 |
| 4 | Straight / Flush / Full House (pat) | Hold all |
| 5 | 4 to a Straight Flush | — |
| 6 | Two Pair | Draw 1 |
| 7 | High Pair (J–A) | — |
| 8 | 3 to a Royal Flush | — |
| 9 | 4 to a Flush | — |
| 10 | Low Pair (2–10) | — |
| 11 | 4 to an Outside Straight | — |
| 12 | 2 Suited High Cards | — |
| 13 | 3 Unsuited High Cards | Discard the lowest |
| 14 | 1 High Card | — |
| 15 | Discard all | — |
Intermediate strategy (99.52% RTP) sits between simple and optimal. It is documented separately on the Wizard of Odds intermediate strategy page; most players skip it and move from simple directly to optimal once the underlying logic clicks.
Exceptions and counterintuitive plays
The chart captures correct play for the overwhelming majority of dealt hands. A handful of specific scenarios trip up players because the right answer contradicts initial instinct.
These are the most commonly mis-played hands among players who have learned the chart but not internalised the reasoning.
| Situation | Instinctive play (EV per credit) | Optimal play (EV per credit) | Margin |
|---|---|---|---|
| 4 to Royal vs Pat Flush | Hold pat flush: 6.00 | Draw to royal: approximately 17–19 | Roughly +11 to +13 |
| 4 to Royal vs Pat Straight | Hold pat straight: 4.00 | Draw to royal: approximately 17–19 | Roughly +13 to +15 |
| High Pair vs 4 to Flush | Hold 4-to-flush: 1.28 | Hold high pair: 1.54 | +0.26 |
EV figures for High Pair vs 4-to-Flush (1.54 vs 1.28) verified against published Wizard of Odds methodology. 4-to-Royal draw EV is presented as a range because exact figures depend on discard composition (whether discarded cards include flush penalty cards, straight penalty cards, or none) and on the specific Wizard of Odds calculation. The range 17–19 credits per credit bet covers typical configurations under max-coin play.
4 to a Royal Flush beats Pat Flush
Dealt: ♠10 ♠J ♠Q ♠K ♠3
Wrong instinct: hold all five for the pat flush.
Correct play: discard the ♠3 and draw one card hoping to complete the royal in spades.
The pat flush pays 6 credits per credit bet (a known quantity), while the 4-to-royal completes about 1 in 47 times for an 800× payout on the max-coin schedule. The expected value of the royal draw exceeds the guaranteed flush by a measurable margin.
This is the single most cited counterintuitive play in video poker.
4 to a Royal Flush beats Pat Straight
Dealt: ♠10 ♠J ♠Q ♠K ♣9
Wrong instinct: hold the straight (10 through K plus a 9 makes a 9-K straight).
Correct play: discard the ♣9 and draw for the royal.
The pat straight pays 4 credits; the same royal-draw expected value applies. Pat straight is the lower payout, so the case is even clearer than the pat-flush comparison.
High Pair beats 4 to a Flush
Dealt: ♠J ♠5 ♠7 ♠9 ♣J
Wrong instinct: “almost a flush — draw for it.”
Correct play: hold the pair of Jacks (one spade, one club).
A pair of Jacks-or-better is a guaranteed 1-to-1 payout with potential to improve to three of a kind, full house, or four of a kind. The 4-to-flush completes only about 1 in 4.7 times.
Holding the pair has higher expected value (1.54 vs 1.28 per credit bet) despite the visually attractive flush draw.
Low Pair beats 4 to an Inside Straight
Dealt: ♠5 ♣5 ♠7 ♣9 ♥10
Wrong instinct: “almost a straight — hold the four cards.”
Correct play: hold the pair of 5s, discard the rest.
The inside straight needs specifically an 8 to complete — 4 outs out of 47 unseen cards. The low pair has improvement potential to three of a kind (about 1 in 8) plus other paying upgrades. Pair wins on expected value.
Unsuited 10-J-Q-K is worth holding
Dealt: ♠10 ♣J ♠Q ♣K ♥3
Wrong instinct: “no pair, no flush — discard everything.”
Correct play: hold the 10-J-Q-K and draw one card.
Eight outs to make the straight (any 9 or any Ace), plus high-card pairing fallbacks if the straight misses. Strong combined expected value compared to discarding all five cards.
3 to a Royal Flush over 4 to a Flush
Dealt: ♠J ♠Q ♠K ♠4 ♥9
Wrong instinct: keep four spades and draw for the flush.
Correct play: hold the spade J-Q-K and discard the ♠4 and ♥9.
The 4-to-flush completes more often (about 1 in 4.7), but the suited J-Q-K royal draw carries enough upside — including straight, flush, high-pair, and royal completions — to rank higher in the 9/6 Jacks or Better strategy chart.
Rare penalty-card exceptions exist where a 4-to-flush beats a 3-to-royal, but they require specific discard configurations.
One High Card beats a weak Inside Straight Draw
Dealt: ♠A ♦2 ♣3 ♥4 ♣9
Wrong instinct: hold A-2-3-4 and draw for the 5.
Correct play: hold only the Ace, discard the rest.
A-2-3-4 is an inside straight draw because only one rank (the 5) completes it — 4 outs out of 47. A lone high card pairs to Jacks-or-better about 1 in 3.5 times, giving the single-card hold higher expected value than the weak straight draw.
Each of these plays is small in isolation — the cumulative cost of mis-playing them all over a 1,000-hand session is on the order of a few credits at 5-credit-per-hand stakes. But for players who play often, internalising these decisions is what separates simple-strategy returns (99.46%) from optimal returns (99.54%).
Practical learning path
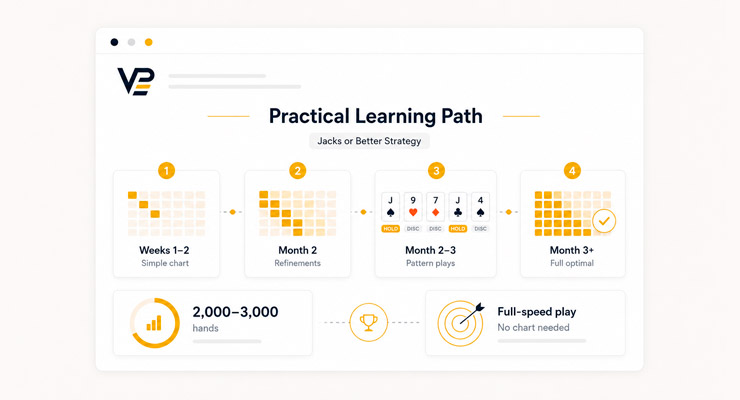
Strategy fluency develops over months, not days. A reasonable progression:
- Weeks 1–2: Learn the simple strategy chart. Practise on a video poker trainer (Wizard of Odds offers a free browser-based trainer) or on a free-play machine at low denomination. The goal is recognising hand types instantly — pair, two pair, three of a kind, pat straight, pat flush — without conscious effort.
- Month 2: Begin adding optimal-chart refinements. Focus first on the priorities that differ between simple and optimal — particularly 4-to-straight-flush ranking, 3-to-royal sub-types, and the inside-straight-with-high-cards case.
- Month 2–3: Internalise the counterintuitive plays from the section above. These are where simple-strategy players consistently leak expected value. Each one corresponds to a specific dealt-hand pattern; recognising the pattern is the prerequisite for playing it correctly.
- Month 3+: Apply the full optimal chart with the edge cases from the Wizard of Odds reference page. By this point, casual play should run at full speed without chart consultation; chart use returns only for unfamiliar marginal hands.
The total practice volume for fluent optimal play is roughly 2,000–3,000 hands of focused chart application. That can be compressed into a few weekends with a dedicated free-play trainer or stretched over months of casual learning sessions.
Common strategy mistakes and their cost
Strategy errors compound over volume. The five most common mistakes among intermediate players, with rough cost-of-error estimates:
- Holding a pat flush over 4-to-royal — costs about 0.5 credits per occurrence. Rare hand, high cost when it happens
- Discarding a low pair to chase 4-to-flush — costs about 0.1 credits per occurrence. Common hand, modest cost, frequent error
- Holding 4-to-inside-straight over low pair — costs about 0.08 credits per occurrence
- Playing fewer than five coins — costs approximately 1.4–1.5 percentage points of sustained RTP. On 1-coin play, the royal flush pays 250 per coin instead of 800 per coin on max-coin play. With the standard 9/6 strategy applied, total return drops from 99.54% to about 98.01%. Not a chart mistake, but the single largest leak in real play
- Using 9/6 strategy on an 8/5 machine — costs about 0.1 percentage points sustained. Close enough strategies that most players default to 9/6 chart on 8/5 machines without significant loss; matching the machine is marginally better
The cumulative leak from chart mistakes 1–3 over a typical 1,000-hand session for an intermediate player is roughly 0.05–0.15 percentage points of RTP — consistent with the theoretical 0.08 percentage point simple-vs-optimal cost difference.
For a focused look at three-of-a-kind decisions in particular, see the Jacks or Better trips and three of a kind guide.
Common questions
How long does it take to memorise the full optimal chart?
Most players reach reliable optimal play after 2,000–3,000 practice hands with the chart visible. Full memorisation is not required for casual play — chart consultation is typically permitted at slower game speeds, and standard practice for sharp players is to keep a strategy card handy until the chart is internalised.
Venue rules vary; check before bringing printed materials to a physical casino.
Does optimal strategy change between 9/6 and 8/5 paytables?
Yes, but minimally. The 8/5 paytable shifts a few marginal plays — 4-to-straight with high cards moves up slightly, certain royal draws shift in priority.
The total difference between 9/6 strategy and 8/5 strategy is approximately 0.03–0.05 percentage points of RTP. Most players use 9/6 strategy on 8/5 machines without significant loss; the marginal benefit of paytable-specific strategy refinement is small.
Can I beat Jacks or Better long-term using optimal strategy?
No. Even at 99.54% RTP with perfect play, the house edge is 0.46%. Over millions of hands, the house wins.
Comp programs, promotional cashback, and free-play offers can offset some of this — and in rare cases tip a session into positive expected value — but the base game remains negative EV for the player.
For a genuinely positive-EV video poker option, see the 100.76% RTP Full Pay Deuces Wild guide (positive expected value with caveats around availability and variance).
Methodology and sources
Strategy chart structures, RTP figures, and probability values on this page sourced from Wizard of Odds analyses for 9/6 Jacks or Better (optimal, intermediate, and simple strategies).
Royal flush probability (1 in 40,391) and variance figure (19.51 per single hand, standard deviation 4.42) from Wizard of Odds reference tables. Expected value figures for High Pair vs 4-to-Flush (1.54 vs 1.28 per credit bet) verified against published Wizard of Odds optimal-strategy methodology.
4-to-Royal draw expected value figures presented as a range (approximately 17–19 credits per credit bet) because exact value depends on specific discard composition.
Last verified 12 May 2026. See Editorial Standards for the full verification workflow.